CORRECTED COPY OF NEWS RELEASE ISSUED FEBRUARY 18, 2003
Published on February 21, 2003
Exhibit 99.1
[WAL-MART STORES, INC. LOGO]
(479) 273-4314 www.walmartstores.com/news/
| FOR IMMEDIATE RELEASE |
Investor Relations Contacts |
|
| Investor Relations 479/273-8446 |
||
| Jay Fitzsimmons 479/273-6445 |
||
| Jenifer Webb 479/277-9558 |
||
| Media Relations Contact |
||
| Tom Williams 479/277-0609 |
||
| Prerecorded Conference Call |
||
| 402/998-1748 |
Wal-Mart Reports Record Sales and Earnings
BENTONVILLE, Ark., February 18, 2003 Wal-Mart Stores, Inc. reported record sales and earnings for the quarter ended January 31, 2003. Total sales were $71.073 billion, an increase of 10.7 percent over the similar prior year quarter. Net income for the quarter was $2.529 billion, up from $2.189 billion for the similar prior year quarter. Earnings per share were $0.57, up 16.3 percent from the $0.49 per share reported in the same prior year quarter. Adjusted for the change in accounting for goodwill, basic earnings per share would have been up 11.8% over the corresponding period in fiscal 2002.
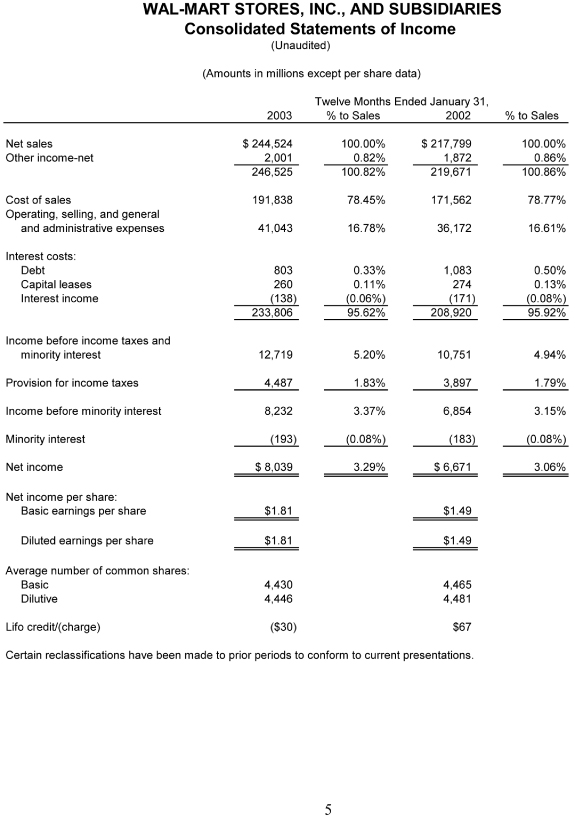
Net sales for the year ended January 31, 2003, were $244.524 billion, an increase of 12.3 percent over the similar prior year period of $217.799 billion. Net income for the year was $8.039 billion, up from $6.671 billion for the similar prior year. Earnings per share were $1.81, up 21.5 percent from the $1.49 per share reported in the same prior year. Adjusted for the change in accounting for goodwill, basic earnings per share would have been up 16.8%.
Lee Scott, President and CEO said, In a challenging retail environment with slowing comparable sales growth, we achieved another year of record sales and earnings. Net income exceeded $8 billion for the year for the first time and sales grew by almost $27 billion.
Sales were as follows:
(Dollars in billions)
| Quarter Ended |
Percent Change |
Year Ended |
Percent Change |
|||||||||||||||
| 2003 |
2002 |
2003 |
2002 |
|||||||||||||||
| Wal-Mart |
$ |
45.490 |
$ |
40.909 |
11.2 |
% |
$ |
157.121 |
$ |
139.131 |
12.9 |
% |
||||||
| SAMS CLUB |
|
8.726 |
|
8.296 |
5.2 |
|
|
31.702 |
|
29.395 |
7.8 |
|
||||||
| International |
|
12.185 |
|
10.809 |
12.7 |
|
|
40.794 |
|
35.485 |
15.0 |
|
||||||
| McLane |
|
4.672 |
|
4.197 |
11.3 |
|
|
14.907 |
|
13.788 |
8.1 |
|
||||||
| Total Company |
$ |
71.073 |
$ |
64.211 |
10.7 |
% |
$ |
244.524 |
$ |
217.799 |
12.3 |
% |
||||||
Total company comparable sales for the quarter were up 2.7 percent. This is represented by a 3.3 percent comp increase for the Wal-Mart stores and a 0.4 percent comp decrease for SAMS. Total company comparable sales for the year were up 5.1 percent. This is represented by a 5.7 percent comp increase for the Wal-Mart stores and a 2.3 percent comp increase for SAMS.
Wal-Mart Stores Segment:
For the fourth quarter, the Wal-Mart Stores segment, including Supercenters, had operating profit (profit before interest, unallocated corporate expenses, and income taxes) of $3.592 billion, an increase of 15.8 percent compared with $3.101 billion for the similar period in the previous year. For the year operating profit was $11.873 billion, an increase of 16.2 percent as compared with $10.221 billion for the similar period in the previous year.
SAMS CLUB Segment:
The SAMS CLUB segment had an operating profit for the quarter of $295 million, a decrease of 0.7 percent compared with $297 million for the similar period in the previous year. SAMS operating profit for the year was $1.028 billion, which was unchanged from the similar period in the previous year.
International Segment:
The International segment had an operating profit of $757 million for the most recent quarter, an increase of 37.6 percent compared with $550 million for the similar period in the previous year. For the year, International operating profit was $2.033 billion, an increase of 55.8 percent as compared with $1.305 billion for the similar period in the previous year.
A pre-recorded call offering additional comments on the quarter will be available to all investors for approximately 36 hours from the time of the release. You may listen to this call by dialing 402-998-1748.
As of January 31, 2003, the Company had 1,568 Wal-Mart stores, 1,258 Supercenters, 525 SAMS CLUBS and 49 Neighborhood Markets in the United States. Internationally, the Company operated units in Argentina (11), Brazil (22), Canada (213), China (26), Germany (94), Korea (15), Mexico (597), Puerto Rico (52) and United Kingdom (258).
Wal-Mart also owns a 34% interest in Seiyu, Ltd. with options to purchase up to 66.7% of that company. Seiyu operates over 400 stores located throughout Japan.
2
Wal-Mart employs more than 1 million associates in the United States and more than 300,000 internationally. Its securities are listed on the New York and Pacific stock exchanges under the symbol WMT.
This release contains statements that Wal-Mart believes are forward-looking statements within the meaning of the Private Securities Litigation Reform Act of 1995, and intended to enjoy the protection of the safe harbor for forward-looking statements provided by that Act. These forward-looking statements generally can be identified by use of phrases such as believe, expect, anticipate, intend, plan, foresee or other similar words or phrases. Similarly, descriptions of our objectives, strategies, plans, goals or targets are also forward-looking statements. These statements discuss, among other things, expected growth, future revenues, future cash flows, future performance and the anticipation and expectations of Wal-Mart and its management as to future occurrences and trends. These forward-looking statements are subject to risks, uncertainties and other factors, domestically and internationally, including, the cost of goods, competitive pressures, inflation, consumer spending patterns and debt levels, currency exchange fluctuations, trade restrictions, changes in tariff and freight rates, interest rate fluctuations and other capital market conditions, and other risks. We discuss certain of these matters more fully in other of our filings with the SEC, including our Annual Report on Form 10-K for our fiscal year 2002, which was filed with the SEC on April 15, 2002; this release should be read in conjunction with our Annual Report on Form 10-K, and together with all our other filings, including Current Reports on Form 8-K, made with the SEC through the date of this report. You are urged to consider all of these risks, uncertainties and other factors carefully in evaluating the forward-looking statements. As a result of these matters, including changes in facts, assumptions not being realized or other circumstances, our actual results may differ materially from historical results or from anticipated results expressed or implied in these forward-looking statements. The forward-looking statements included in this release are made only as of the date of this report and we undertake no obligation to update these forward-looking statements to reflect subsequent events or circumstances.
- # # # -
3
Consolidated Statements of Income
(Unaudited)
(Amounts in millions except per share data)
| Quarter Ended January 31, |
||||||||||||||
| 2003 |
% to Sales |
2002 |
% to Sales |
|||||||||||
| Net sales |
$ |
71,073 |
|
100.00 |
% |
$ |
64,211 |
|
100.00 |
% |
||||
| Other income-net |
|
514 |
|
`0.72 |
% |
|
523 |
|
0.81 |
% |
||||
|
|
71,587 |
|
100.72 |
% |
|
64,734 |
|
100.81 |
% |
|||||
| Cost of sales |
|
56,248 |
|
79.14 |
% |
|
50,912 |
|
79.29 |
% |
||||
| Operating, selling, and general and administrative expenses |
|
11,112 |
|
15.63 |
% |
|
10,024 |
|
15.61 |
% |
||||
| Interest costs: |
||||||||||||||
| Debt |
|
184 |
|
0.26 |
% |
|
237 |
|
0.37 |
% |
||||
| Capital leases |
|
70 |
|
0.10 |
% |
|
73 |
|
0.11 |
% |
||||
| Interest income |
|
(37 |
) |
(0.05 |
%) |
|
(40 |
) |
(0.06 |
%) |
||||
|
|
67,577 |
|
95.08 |
% |
|
61,206 |
|
95.32 |
% |
|||||
| Income before income taxes and minority interest |
|
4,010 |
|
5.64 |
% |
|
3,528 |
|
5.49 |
% |
||||
| Provision for income taxes |
|
1,417 |
|
1.99 |
% |
|
1,261 |
|
1.96 |
% |
||||
| Income before minority interest |
|
2,593 |
|
3.65 |
% |
|
2,267 |
|
3.53 |
% |
||||
| Minority interest |
|
(64 |
) |
(0.09 |
%) |
|
(78 |
) |
(0.12 |
%) |
||||
| Net income |
$ |
2,529 |
|
3.56 |
% |
$ |
2,189 |
|
3.41 |
% |
||||
| Net income per share: |
||||||||||||||
| Basic earnings per share |
$ |
0.57 |
|
$ |
0.49 |
|
||||||||
| Diluted earnings per share |
$ |
0.57 |
|
$ |
0.49 |
|
||||||||
| Average number of common shares: |
||||||||||||||
| Basic |
|
4,412 |
|
|
4,456 |
|
||||||||
| Dilutive |
|
4,425 |
|
|
4,473 |
|
||||||||
| Lifo credit/(charge) |
$ |
0 |
|
$ |
37 |
|
||||||||
Certain reclassifications have been made to prior periods to conform to current presentations.
4